|
| |
Spectrum
Manager IX Screen Samples
PLEASE NOTE: This will take some time to transfer all the images for display.
 Traffic
Analysis Tools Traffic
Analysis Tools
Spectrum Analysis Tools
Monitoring Tools
Trunking Tools
Data
Logging
Other Features
Band Occupancy Scope
Band Occupancy Scope - The Band Occupancy Scope is intended to give a
quick picture of channel usage in a frequency band. This is useful in locating
quiet channels for use in licensing or frequency coordination efforts.
   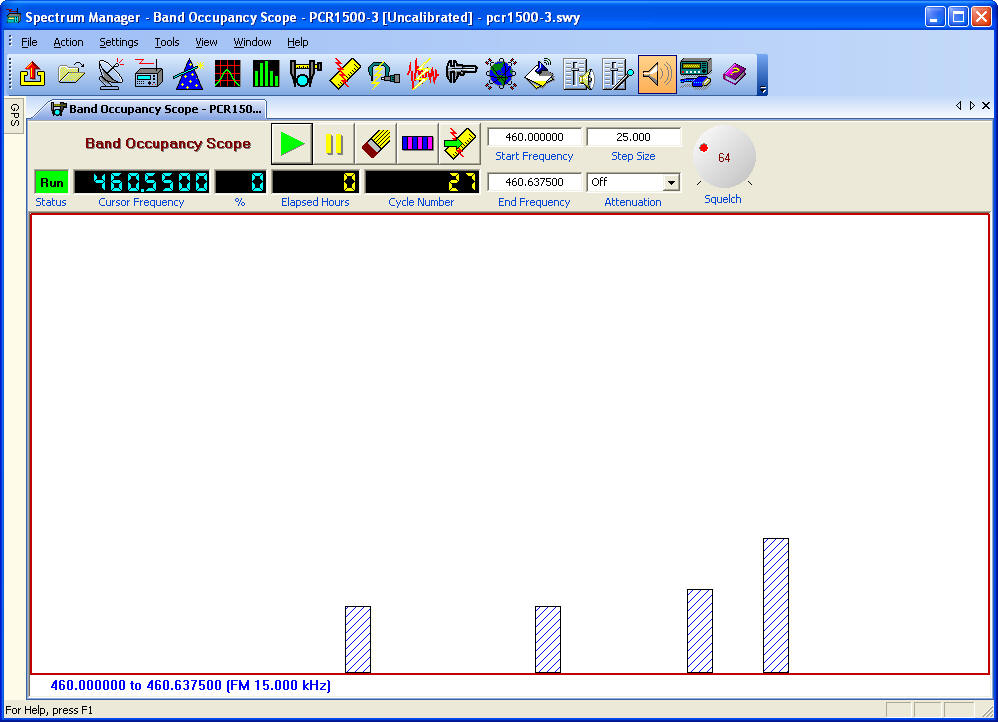
Export to Traffic Analyzer - A key feature of the Band Occupancy
Scope is the ability to prepare files for use with the traffic analyzer.
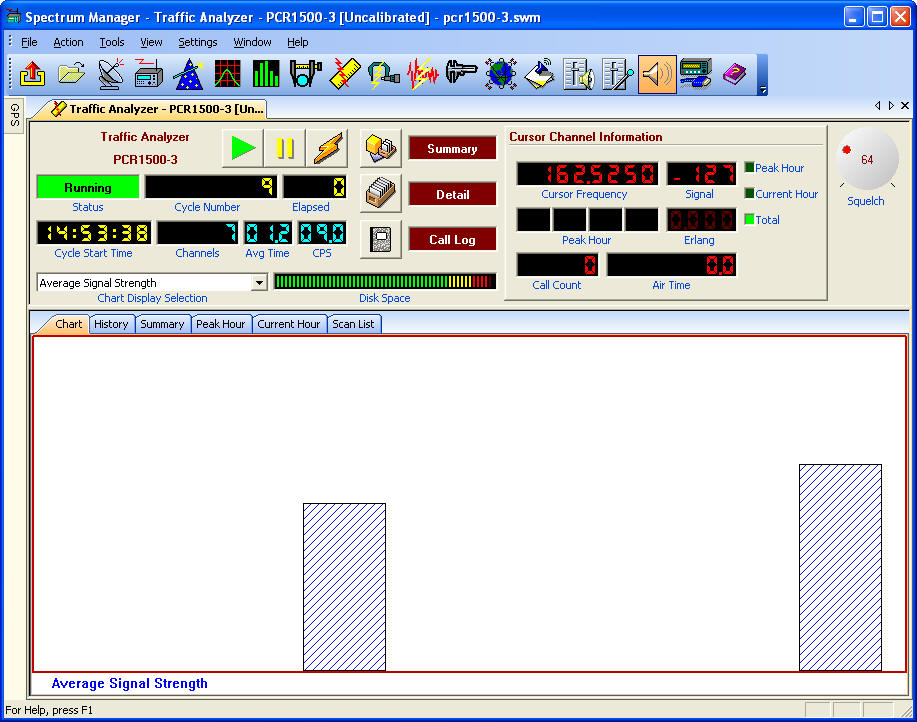
Traffic Analyzer
Traffic Analyzer - The Traffic Analyzer tool is used to gather
accurate statistics on one or more channels. The Traffic Analyzer is typically
used to determine the occupancy of a number of candidate channels. Use the Band
Occupancy Scope (above) to identify candidate channels for the study. All
statistics (detail and summary) are recorded in dBase format for easy reporting
using a spreadsheet or database tool.
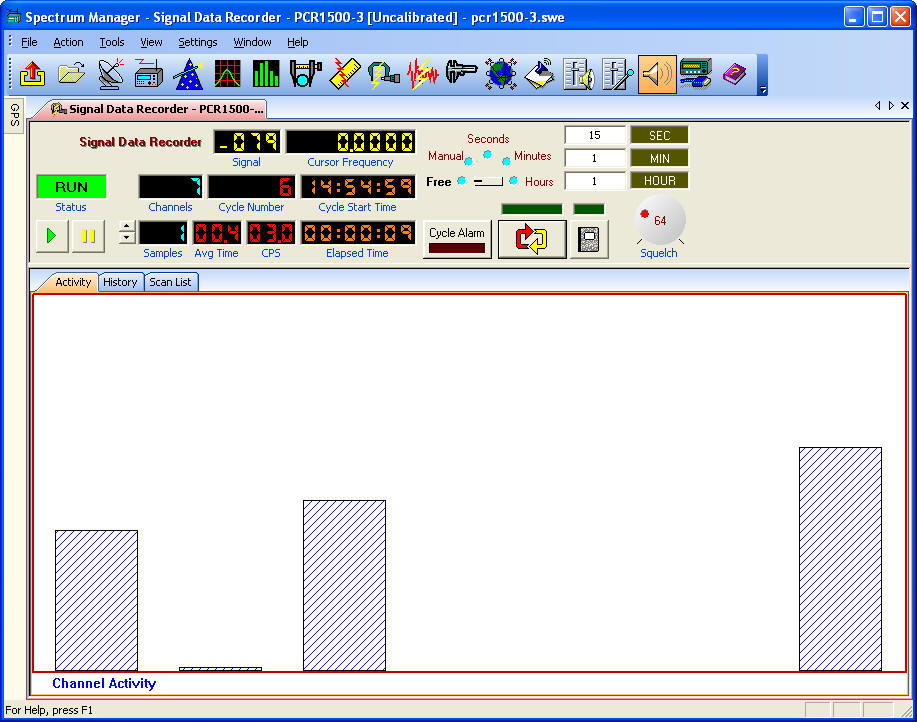
Signal Data Recorder
Signal Data Recorder - The Signal Data Recorder is used to take
periodic measurements of one or more channels. This tool is particularly useful
in coverage mapping, propagation studies, antenna measurements and spectrum
management (enforcement).
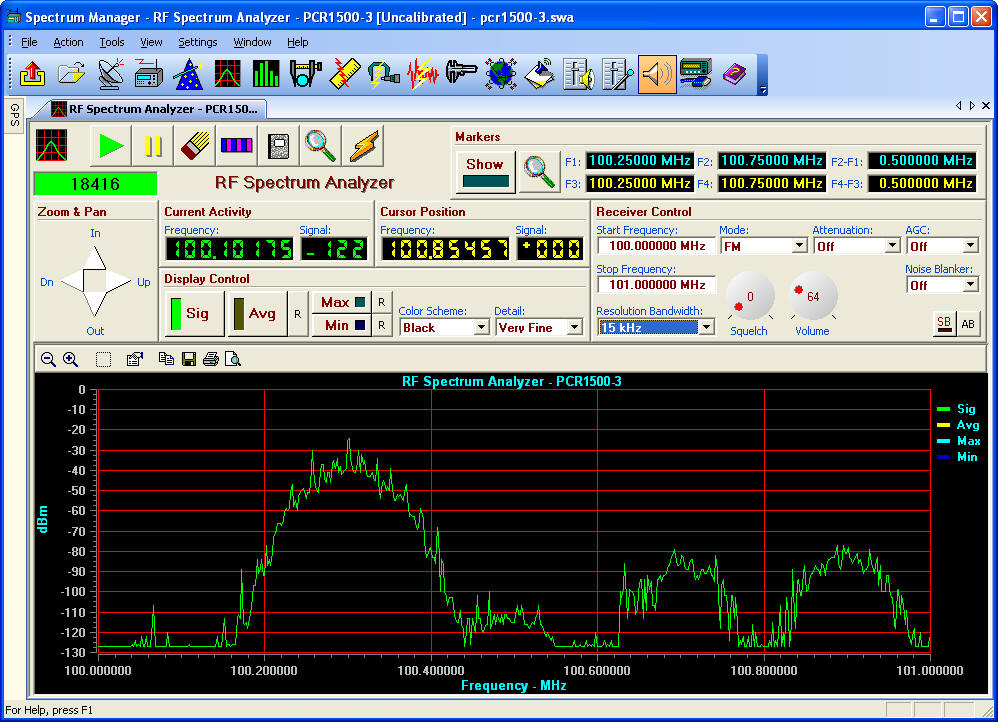
Spectrum Analyzer
Spectrum Analyzer - The Spectrum Analyzer is used to view signal
strength in a band.
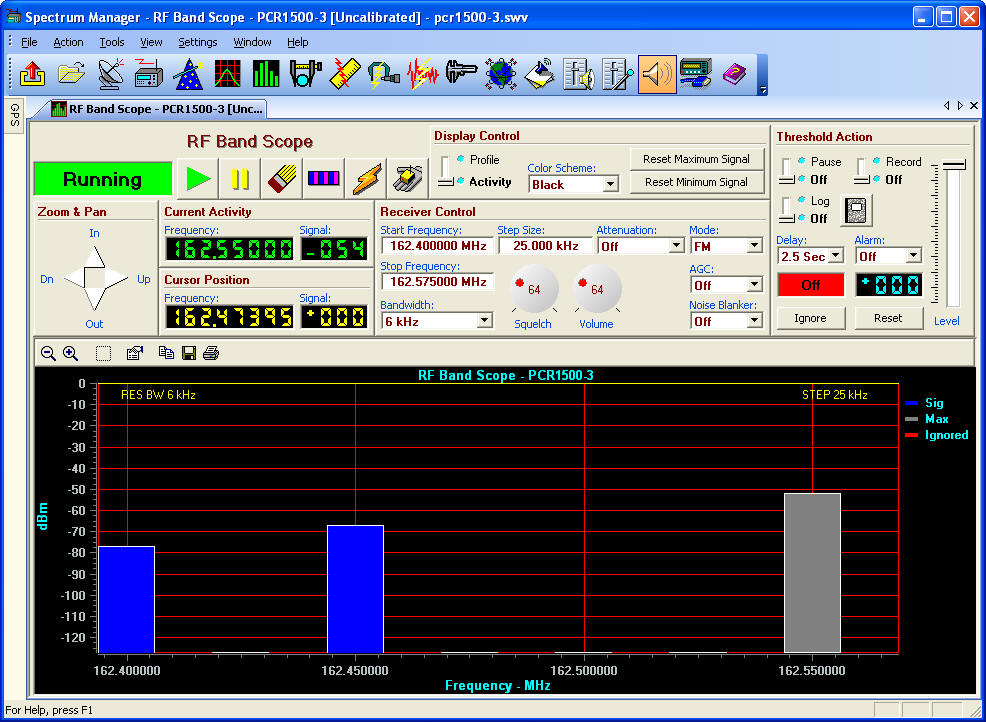
Band Scope
Band Scope - The Band Scope is a versatile tool that can be used to
monitor a range of channels in a band. A threshold level may be set that allows
various actions to be taken when a signal in the band exceeds the threshold.
Monitoring, recording, logging and alarm triggering may all be specified. In
addition, the Band Scope includes a signal power profile view that is useful in
identifying co-channel users. The Band Scope is particularly useful in law
enforcement applications.
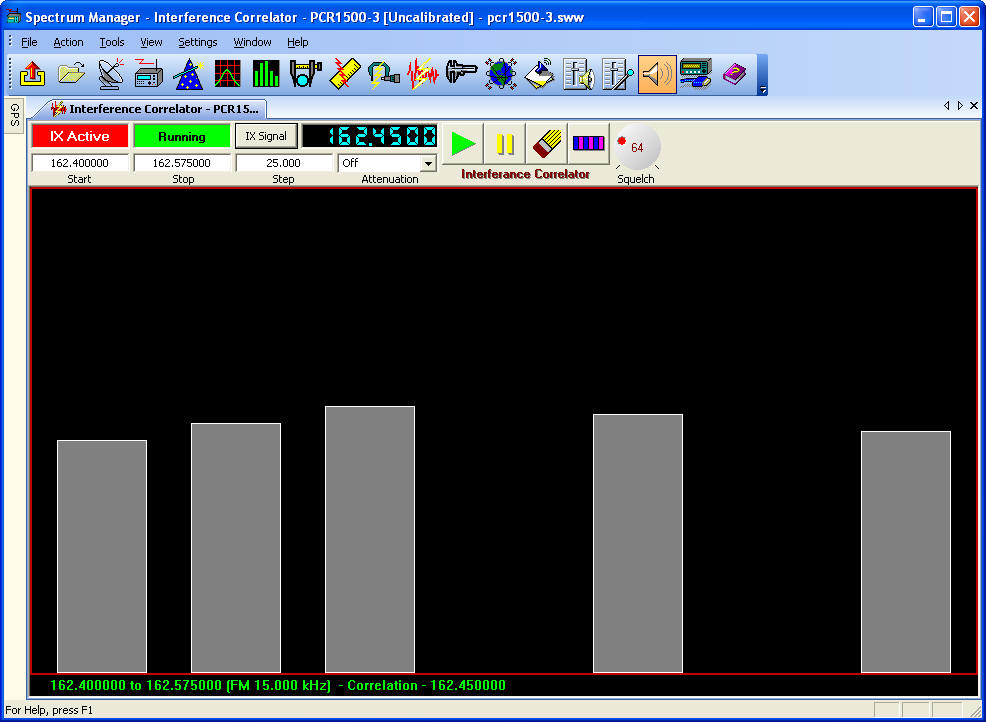
Interference Correlator
Interference Correlator - The Interference Correlator uses a
coincident event correlation technique to identify unknown signals that are
causing interference. Typical uses include identification of unknown
transmitters causing third-order inter-modulation products.
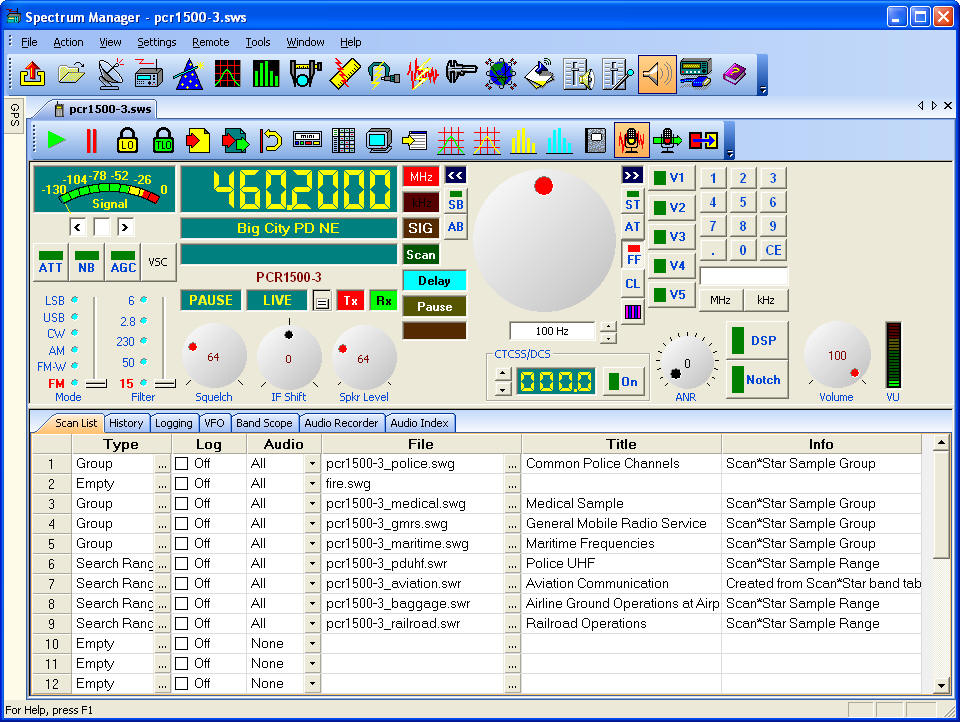
Standard Scanning
Standard Scan Status Display - This is the standard display for
scanning. This screen shot was taken while receiving the ATIS broadcast from San
Jose International airport. This window can be sized and minimized. By choosing
a small font and sizing the window, only a small amount of desktop area is
consumed, allowing other Windows applications to run.
Radio Control with Audio Recording History
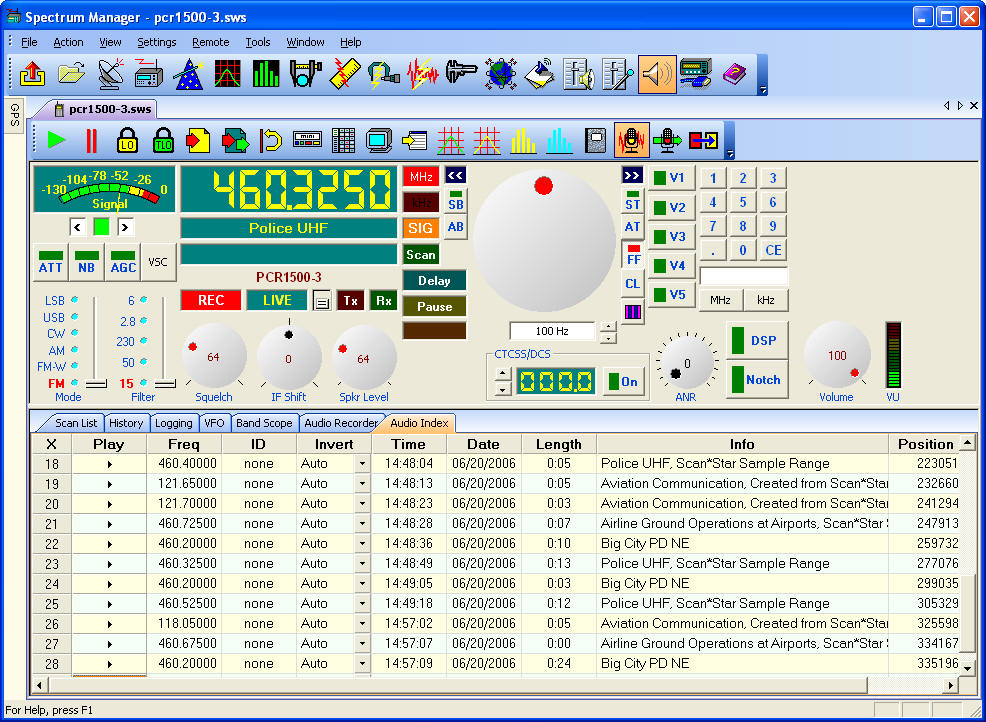
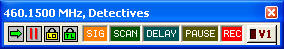
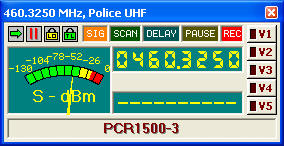
Mini Status Window - This window can be used while other scanning
windows are minimized. The message in the blue area updates as scanning
progresses. A unique attribute of this window is its small features. Although
hard to see here, the choice of font will allow sizing smaller than other
windows. Since this is a "always on top" window, you can place the Mini Status
window over the title bar of another window.
Portion of Tactical Display - This is the upper left quarter of a
Tactical Display window. Since the Tactical Display is a full screen (maximized)
window, including the entire image here would result in an image viewable on
only a few systems. The area at the bottom left is the history list, and shows
the most recent stations received. The columns on the right list all channels in
the scan list. Using a small font will allow more channels to be displayed. Both
the channel and history lists scroll. Clicking the mouse on a channel entry (in
the program, not here) will allow scan/skip, alarms, priority and other settings
to be changed while scanning.
A major feature of the Tactical Display is the ability to quickly tailor the
monitoring environment as the situation changes. The green box in each cell is
actually a status button and indicator. Green means the channel is currently
enabled for scanning. Red means skip (locked out). Changing the setting is as
easy as clicking on the button with the mouse. When you click the mouse button
on another part of the cell, Scan*Star locks all the other channels out,
allowing you to focus on just that one channel. Other channels can be unlocked
by clicking on their respective status buttons.
For example, suppose you are listening to your standard scan program when an
incident occurs that requires your attention, and you want to focus your
scanning on four channels, ignoring all other. To do this, you click the mouse
button on the cell of the first channel, then click the status button of the
remaining three channels. Scan*Star will then scan only these four selected
channels. When focused scanning is no longer needed, you click on the Reset
button. The Reset button returns all channels to their original state.
Complete Tactical Display - This very large image may not be viewable
on your system, or may appear distorted. The yellow rectangle is a pop-up
information window that displays information about the object underneath the
cursor.
The Scan List - The scan list tells Spectrum Manager what to scan.
Up to 25 Groups, Search Ranges and Single Channels can be referenced from a
single scan list. You can create any number of scan list files, facilitating
incident-related scanning. Spectrum Manager also uses the scan list to determine
which entries are logged or recorded.
Trunking Data Analyzer - The Trunking Data
Analyzer decodes the control channel of a trunking system and displays system
information, talk groups and activity.
ID List - The ID list identifies user ID codes for trunking systems.
Fleet Map and System Type - Each Scan*Star bank can have channels for
one trunking system and any number of non-trunking channels. The Fleet Map
dialog box allows the user to select the trunking system type, and in the case
of Motorola Type I or hybrid systems, the fleet mapping.
Spectrum Manager supports several forms of intercept logging. All log
methods can be operating at the same time.
Intercept logging is supported with the following tools:
- Standard and trunked scanning
- Traffic Analysis
- Signal Data Recorder
- Band scope
Log Selection - Intercept logging is controlled through the log setup
dialog:

ASCII Text Format - ASCII text files suitable for printing, editing
or importation into spreadsheets or database programs. Logged data includes
frequency, channel name, mode, air time, date and time. Signal strength is
provided if the associated radio provides it. If PL, DPL or DTMF tones are
decoded, they are included in the log. here are some sample ASCII lines:
- SAM-XP DEMO-1 157.375000M -088 -090 -088 Marine Band 9/28/2002 16:12:36
000003.2 STO
- SAM-XP DEMO-1 157.100000M -089 -090 -089 Marine Band 9/28/2002 16:12:43
000002.7 STO
- SAM-XP DEMO-1 157.125000M -093 -094 -089 Marine Band 9/28/2002 16:12:48
000003.5 STO
Comma Delimited Format (.CSD) - Comma delimited files are
suitable for printing, editing or importation into spreadsheets or database
programs. Logged data includes frequency, channel name, mode, air time, date and
time. Signal strength is provided if the associated radio provides it. If PL,
DPL or DTMF tones are decoded, they are included in the log.
- "SAM-XP","DEMO-1",157225000,"",-87,-88,-86,"Marine
Band",09/28/2002,16:12:28,2.0,"STO "
- "SAM-XP","DEMO-1",157375000,"",-88,-90,-88,"Marine
Band",09/28/2002,16:12:36,3.2,"STO "
Binary Format - The binary log format is intended for special
purposes where log data will be directly processed by other software
applications. The binary log format is documented in the Spectrum Manager User
Manual.
dBase Format - Spectrum Manager can write log data to dBase database
files. Since most spreadsheets can work with database files directly, data
analysis and reporting is easy and convenient. In addition, custom programs for
reporting or customer billing can be built using industry standard software
tools. Use dBase format when you need to transfer data to other applications,
such as mapping software. The following screen shows a dBase log file created by
Spectrum Manager being edited by the dBase file feature of Spectrum Manager.

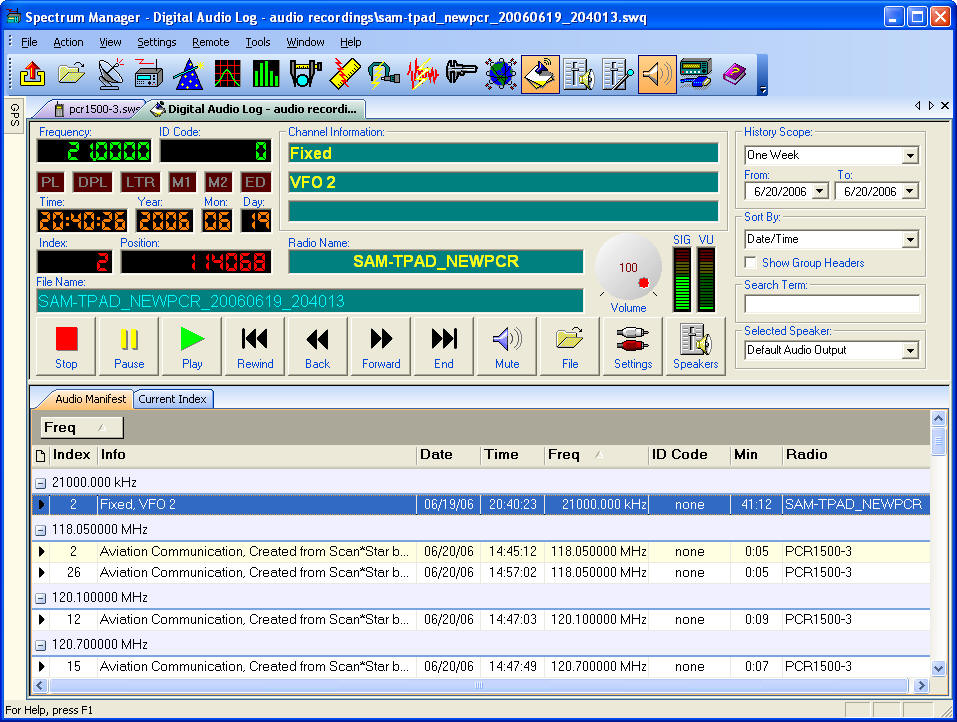
Digital Audio Logger
Digital Audio Logger - The Digital Audio Logger allows
received audio from one or more radios to be recorded to hard disk using a sound
card. Each sound bite is recorded with complete time and channel information. As
you play back recorded audio, the actual time of intercept is displayed along
with the frequency, PL/DPL tone and channel identification. Fast forward and
rewind buttons are provided for quick browsing. Audio compression is used to
minimize the amount of hard disk space used. Any Windows compatible sound card
can be used.
Audio Manager
Compression - Audio compression is a technology that reduces the
amount of raw data by removing some information and collapsing redundant
sequences of repeated data. This is known as lossy compression. Dramatic
reductions in the amount of disk space can be achieved at the expense of
processor time and delay. As the level of compression increases, the amount of
time required by the processor to perform the compression increases. Since
compression always results in the loss of some data, distortion of the original
signal occurs. The greater the amount of compression the mode distorted the
sound will be on playback.
The sampling rate is the rate at which the audio signal is sampled, and
determines the frequency response of the recorded sound. High rates result in
high frequency response but require huge amounts of disk space. Rates as high as
44 KHz are used for CD quality audio, but most radio transmissions can use 8
KHz, or even 4 KHz.
Various compression techniques and data sampling rates are available, and
vary depending upon the type of CODEC chip on your sound card, the compression
mode supported by the sound card driver and the version of Windows you have
installed. Some common compression and sampling rate combinations are shown here
for comparison. The combinations you have on your computer may be different.
FORMAT |
SAMPLING RATE |
AVERAGE DATA RATE |
PCM |
11 KHz
Mono |
11 Kb/Sec |
PCM |
22 KHz
Stereo |
86 Kb/Sec |
ADPCM |
8 KHz Mono |
4 Kb/Sec |
ADPCM |
44 KHz
Stereo |
43 Kb/Sec |
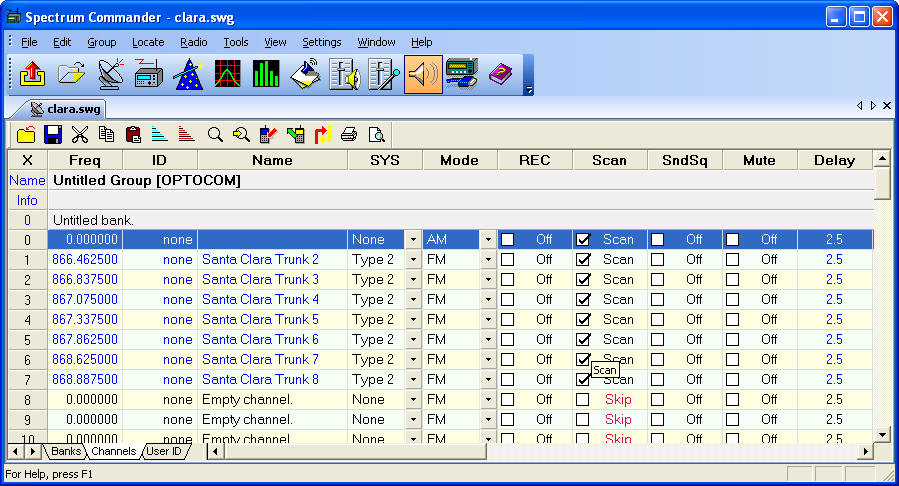
Data Management
Scan Groups - Groups are database files organized as banks of
channels. The fields available in a group are determined by the type of radio
used.
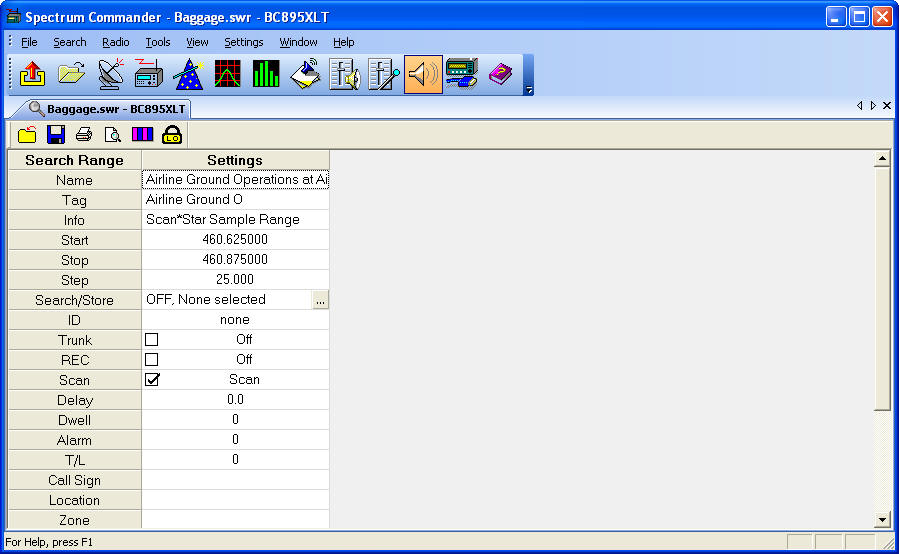
Search Ranges - Range files describe a frequency band that will be
used in search operations. At a minimum a range consists of the start,
stop and step frequencies, and the reception mode. Like group files, the fields
available in a group are determined by the type of radio used.
Intercept History
- The last 20 intercepts are saved in each channel and search range.
Global Radio Settings - You can view or change
global radio settings on a number of different radio types.
Radio Calibration
Radio Calibration - The radio calibration tool allows a receiver's
RSSI curve to be measured and recorded. When a radio is calibrated using this
tool, all signal strength measurements reported by Spectrum Manager are
corrected using the calibration data.
Configuration
System Configuration - All configuration of Spectrum Manager is done
through the System Configuration dialog.
Radio Configuration - Up to 10 receivers can be connected and
operated by Spectrum Manager. Simultaneous operation is possible provided that
sufficient serial ports are available to connect each radio.
|